A hotel with 38 active distribution channels and visibility into only 5 of them is managing rate parity by exception, not by design. The properties gaining revenue ground in 2026 are the ones using AI travel data scraping to monitor every channel continuously — and reading OTA data intelligence to anticipate demand weeks before it appears in their own booking systems.
| <8 min | avg. rate parity violation detection time |
| +23% | direct booking share with active parity enforcement |
| 15–22% | RevPAR improvement with AI-driven revenue management |
| $8K–$45K | annual revenue lost per property to undetected violations |
1. Why Traditional Rate Parity Monitoring Is Becoming Obsolete
Rate parity monitoring was designed for a distribution environment where prices changed once a day and channel managers reviewed reports weekly. The 2026 OTA ecosystem runs on real-time dynamic pricing, metasearch engines compare rates in milliseconds, and a guest with three browser tabs open will detect a pricing discrepancy faster than most hotel revenue teams process a manual alert. The enforcement model has to match the speed of the environment it is policing, a benchmark tracked closely by hospitality data authorities like STR.
From price parity to content parity
Modern distribution agreements cover more than price. They cover content: room descriptions, photograph count and quality, cancellation policies, amenity listings. An OTA displaying a property with images from before a renovation, or without a newly introduced flexible cancellation policy, creates a conversion disadvantage even when the price is identical across channels. Monitoring content parity requires structured text and image extraction across every channel — a dimension of travel data scraping that keyword-based price alerts cannot address.
The distribution ecosystem you do not know you have
A chain that signed rate parity agreements with 12 primary OTAs likely has 30 to 40 channels actively selling its rooms — including sub-distributors, bed banks reselling to secondary OTAs, and affiliate aggregators operating without a direct parity agreement. These undiscovered channels account for an estimated 30–40% of all rate parity violations in properties Scraping Pros has audited. Systematic travel data scraping across metasearch results and price comparison engines maps the full distribution footprint before enforcement begins — including the channels that were never in the contract.
2. AI Travel Data Scraping for Demand Signal Architecture in Hospitality
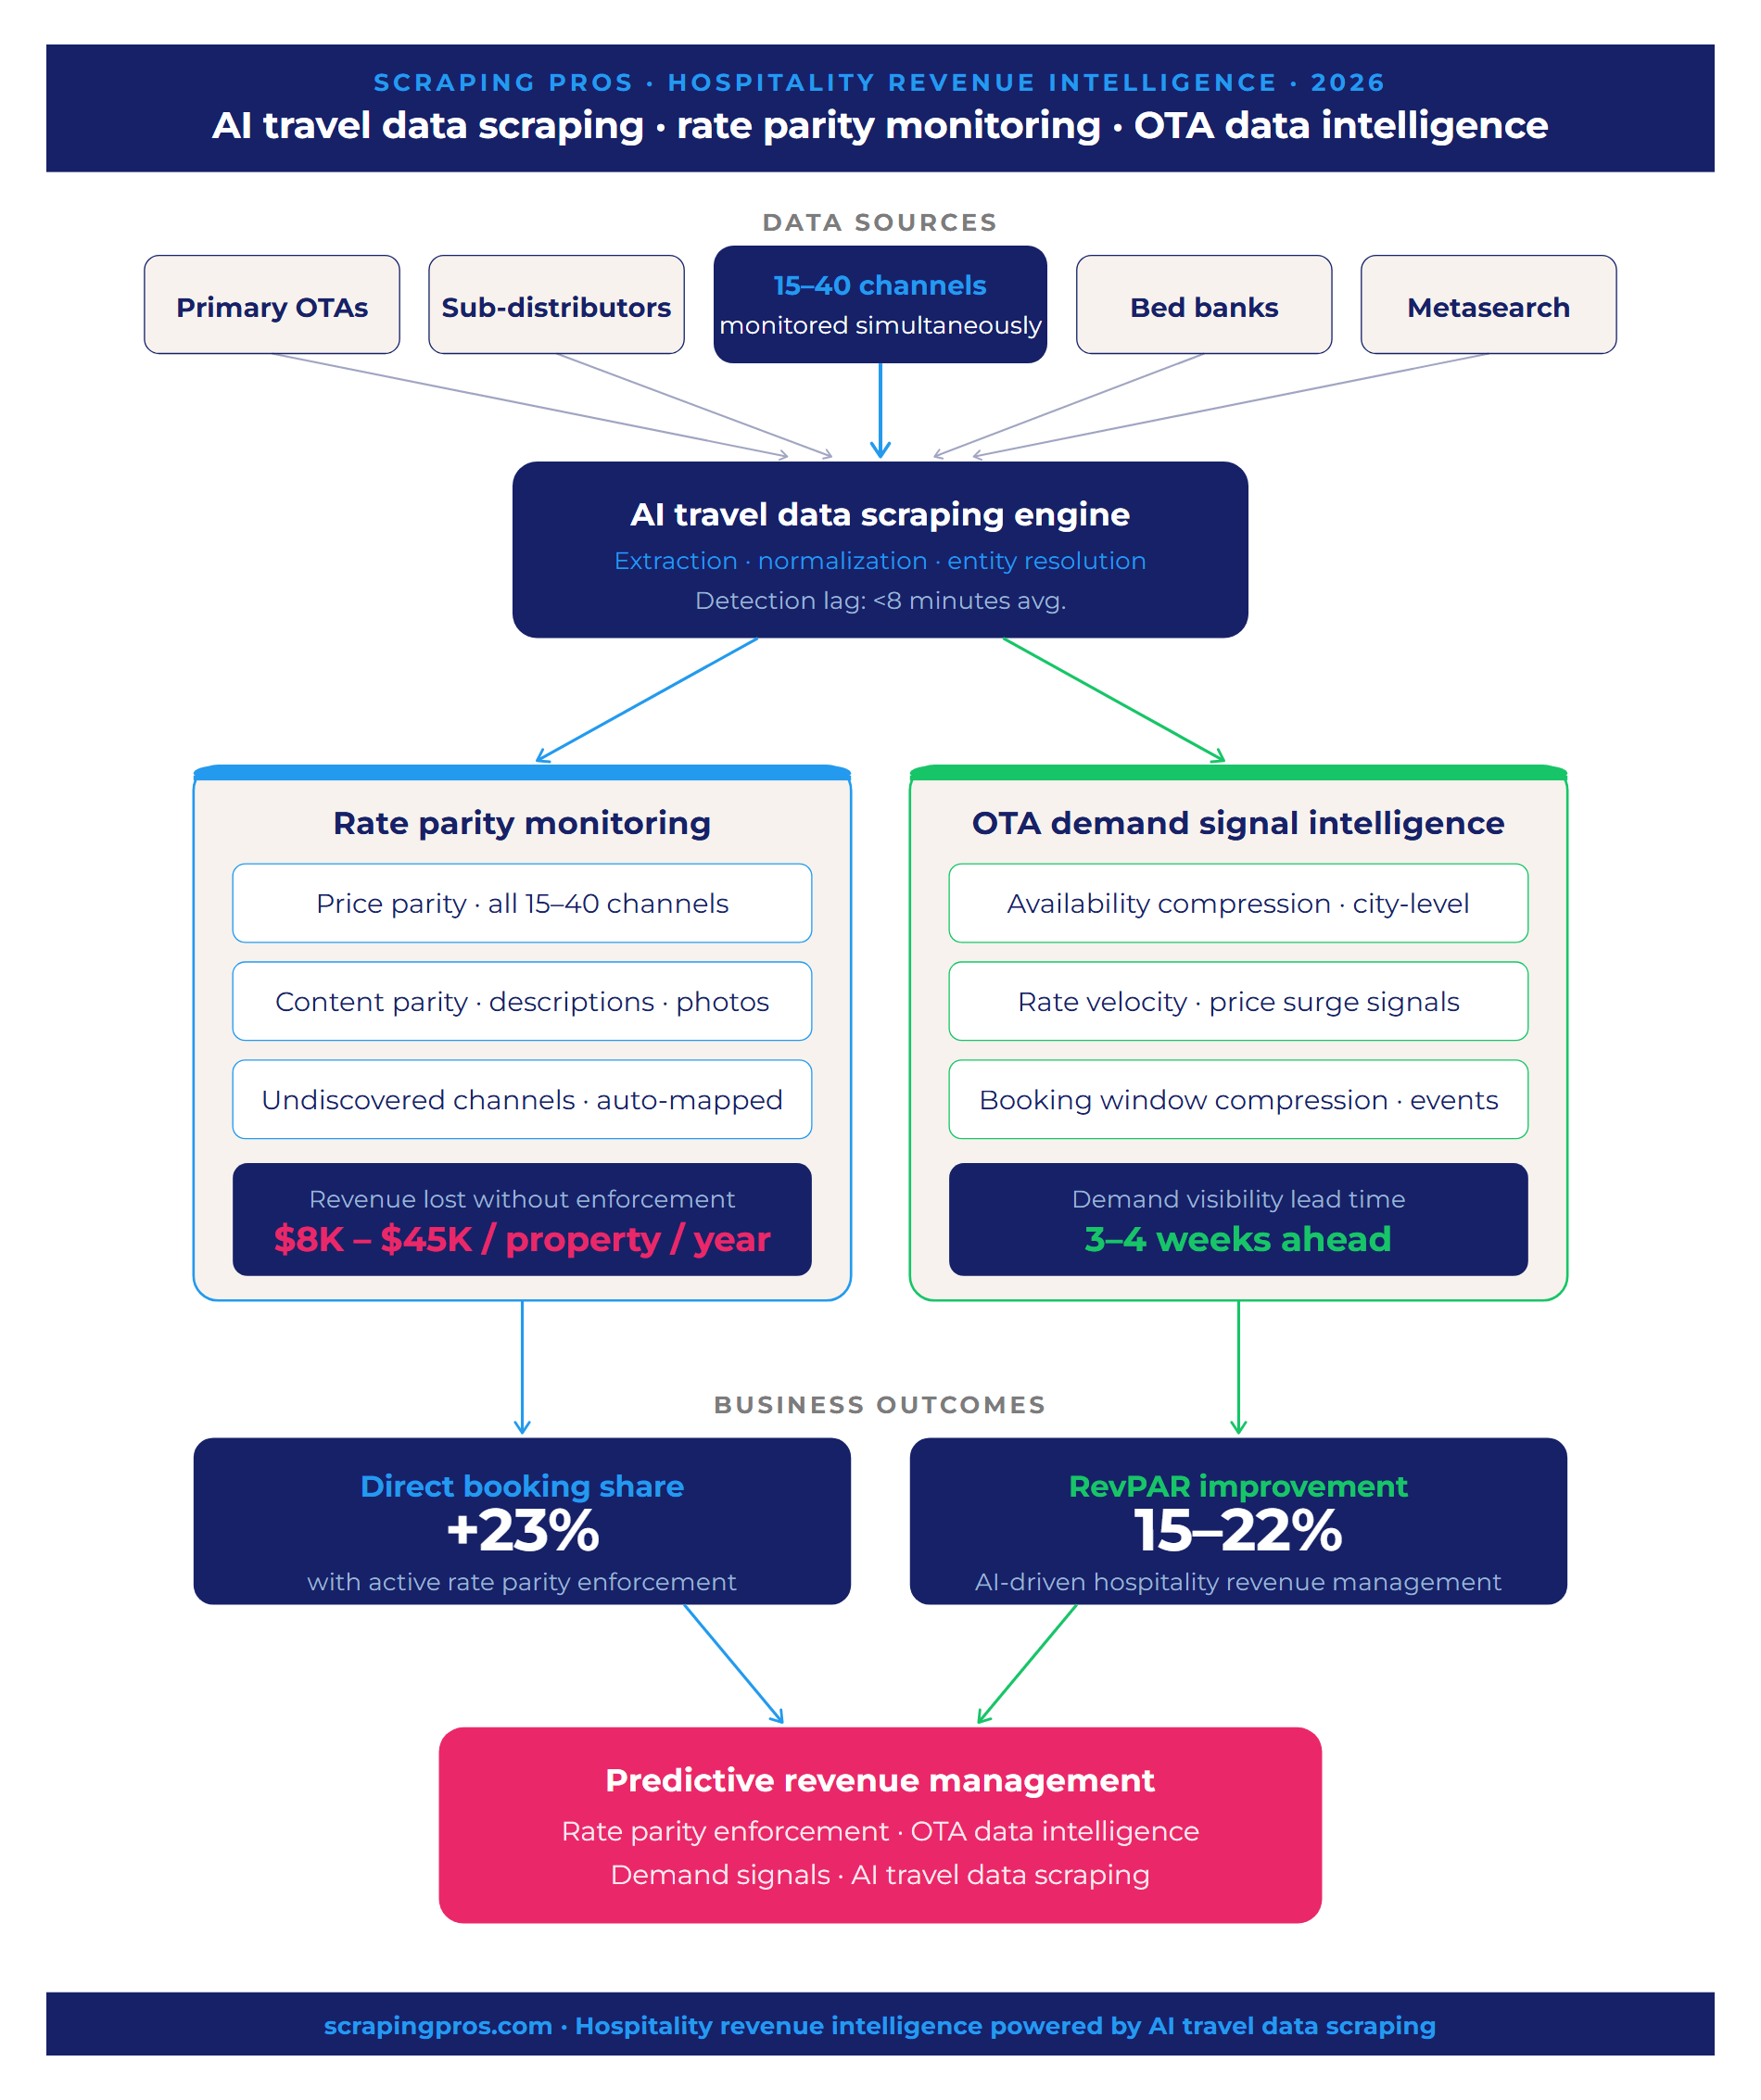
The deepest value in AI travel data scraping goes beyond rate monitoring. OTA data intelligence architecture extracts signals about future demand that most hotel revenue systems are not reading. Extracting and modeling those signals produces demand forecasts with a 3–4 week lead time over anything available in a property management system.
Five sources that anticipate demand weeks in advance
- OTA availability compression: when available properties in a city for a specific date drop more than 30% in 48 hours, that compression is a demand signal. It requires only counting available listings twice daily — data completely public, systematically ignored as a market signal.
- Rate velocity patterns: the speed at which average nightly rates rise for a destination is more informative than the rates themselves. A destination where prices climb $40 in 72 hours for dates three weeks out is signaling an event-driven demand surge before any internal booking system registers it.
- Search result positioning shifts: a property that drops in OTA search rankings without a price or rating change is being displaced by competitors improving their conversion signals — typically through flexible cancellation or added benefits. Monitoring OTA ranking positions is a real-time competitive indicator.
- Review velocity and sentiment: a competitor property receiving a spike in negative reviews around a specific issue — construction noise, ownership transition, service disruption — creates a booking displacement window of 4–8 weeks. Systematic review velocity monitoring surfaces that opportunity while it is still open.
- Event-adjacent signals: convention portals, festival sites, and airline pricing for a destination all carry demand information that precedes OTA availability changes by weeks. Correlating those sources with historical occupancy patterns produces demand forecasts the property’s own data cannot generate.
Demand signal monitoring through AI travel data scraping provides 3–4 weeks of lead time on occupancy spikes. In markets like Latin America — where booking windows are shorter and demand volatility is higher than in European or North American markets — that lead time is the difference between capturing a peak at optimal rates and reacting to it after the inventory has filled at suboptimal pricing.
3. Predictive Revenue Management: From OTA Data to Optimal Pricing
OTA data intelligence feeds predictive revenue management when the travel data scraping pipeline is correctly structured. Three applications that directly improve RevPAR:
- Dynamic competitive set definition: the comp set for a given night changes with demand level. At high occupancy, a property competes with options outside its normal price tier. A static quarterly comp set review misses this. Systems that redefine the competitive set per date — based on live availability and pricing across OTAs — produce rate recommendations calibrated to actual market conditions, not to an average.
- Length-of-stay optimization: OTA search and booking patterns reveal elasticity of stay that internal systems do not capture. When guests consistently search for 3 nights and book 2 because the third night is priced above their threshold, that pattern is visible in OTA data and addressable through minimum stay pricing adjustments.
- Booking window intelligence: when a specific date fills at an unusually compressed booking window, it signals last-minute demand that justifies a different pricing posture than the same dates in prior years. Monitoring booking velocity on OTAs surfaces this before the property’s own inventory data makes it visible.
Combined, these three mechanisms explain most of the 15–22% RevPAR improvement observed in properties operating mature AI-driven revenue management programs. Rate parity enforcement contributes by recovering direct booking share; demand signal monitoring contributes by enabling earlier price adjustments; and booking window intelligence captures last-minute yield that flat pricing strategies leave on the table.
4. Case Study: Resort Group in the Caribbean and Mexico
The following case reflects a Scraping Pros deployment with a resort group operating 14 all-inclusive properties across Mexico and the Caribbean. Company name withheld.
Starting condition
Rate parity monitoring: weekly manual review of 6 OTAs for 4 flagship properties. Estimated coverage: under 20% of active distribution channels. The revenue management team had no systematic visibility into demand signals beyond their own booking pace data. Booking windows in the LATAM source markets (Mexico, Brazil, Colombia, Argentina) averaged 9 days — significantly shorter than the North American and European segments the team was accustomed to managing.
Channel discovery and rate parity deployment
The engagement began with a full distribution audit via travel data scraping across metasearch engines, OTA aggregators, and wholesale channels for all 14 properties. Findings: 31 active channels versus 6 monitored — the undiscovered 25 included bed banks selling through secondary OTAs, regional travel agency portals with direct inventory access, and three affiliate aggregators operating without parity agreements. The 25 unmonitored channels were responsible for 61% of detected violations in the first month of automated monitoring.
Automated rate parity monitoring — powered by continuous travel data scraping — was deployed across all 31 channels with 15-minute refresh cycles on primary OTAs and hourly cycles on secondary channels. Average detection time in the first month: 7.4 minutes. Violation volume in the first 30 days: 1,240 — compared to the team’s estimate of 8–10 per month based on manual reviews.
Demand signal integration for short booking windows
Standard demand signal models are calibrated for booking windows of 30–90 days. The LATAM segment required recalibration for a 9-day average window. The demand signal architecture was adapted to track availability compression and rate velocity changes with 2-hour granularity for the next 14 days — a tighter monitoring frame than standard hospitality deployments but necessary for markets where demand materializes and books within days.
The first commercially significant output: 18 days before a national holiday week in Mexico that the team had not flagged as a high-demand period, OTA availability compression and rate velocity signals indicated sustained demand across the relevant destination cluster. The team raised rates across the three affected properties 16 days in advance. Those three properties ran at 97% occupancy during the period at rates 28% above the original pricing plan.
Business outcomes at 12 months
- Rate parity violations: reduced from 1,240 per month (first month baseline) to 34 per month at month 12 through systematic enforcement.
- Direct booking share: +19% across the portfolio, with the strongest gains in the LATAM source markets where OTA commission structures are most aggressive.
- RevPAR improvement: 17% year-over-year across the 14 properties, with the highest gains in properties with the shortest baseline booking windows.
- Revenue recovered from parity enforcement: estimated $380,000 in the first year across the portfolio, based on direct booking share gains attributable to enforcement.
- Demand signal lead time: average 14 days in the LATAM segment versus the 3–4 weeks typical in European markets — shorter, but sufficient to execute meaningful pricing adjustments ahead of peak demand.
The data point that most influenced the client’s view of the system: the undiscovered channels accounted for the majority of violations, and those channels would have remained invisible without systematic travel data scraping across the full distribution ecosystem. Manual monitoring of known channels produces compliance data for the channels being watched — not for the market.
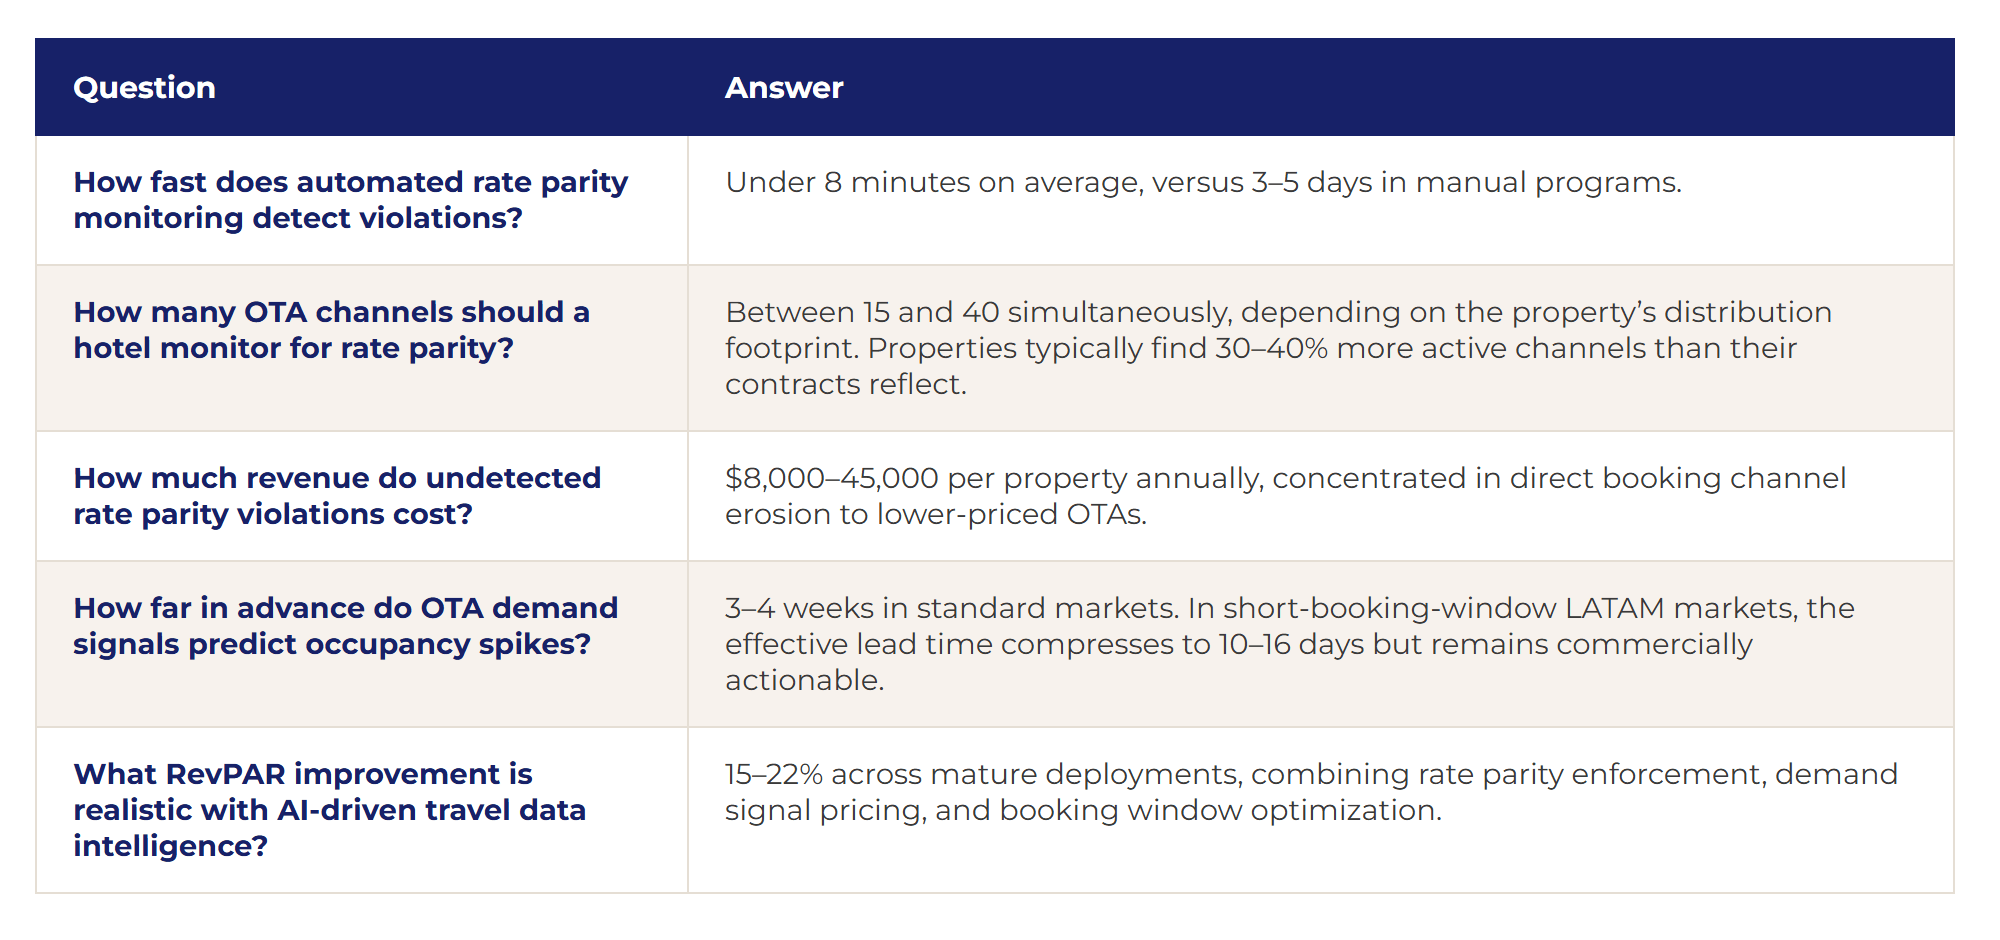
5. Frequently Asked Questions