
Price monitoring software captures competitor prices, promotions, stock levels and listings across channels continuously, so a business can act on market moves while they still matter. Timing is the whole point: academic research from Harvard shows that the monthly share of changing prices at large US retailers roughly doubled within a decade.
Black Friday falls on November 27 this year, and the pricing pressure arrives well before it. Last year, the five days from Thanksgiving to Cyber Monday generated $44.2 billion in US online sales, with Black Friday alone reaching a record $11.8 billion, up 9.1% year over year. In that window, the price observed yesterday can already be outdated. This guide explains what price monitoring involves, how fast competitor prices actually move, and how to set a capture frequency that matches each category.
What Price Monitoring Actually Means
Price monitoring software automates the systematic, repeated collection of competitor pricing data from public sources, such as retailer websites, marketplaces and comparison engines. The data is then normalized so that the same product can be compared across sellers and over time. A complete program tracks four variables: the listed price, active promotions, stock availability, and the content of the listing itself.
The scope is wider than most teams assume. A single television model can be on sale at the same moment on the brand’s own store, at two national retailers and through dozens of marketplace sellers, each at a different price. Price monitoring software that covers only the largest competitor leaves most of that picture unobserved.
Behind every dashboard sits a data layer with four stages: capture, normalization, product matching and change detection. Matching is usually the hardest stage. The same product appears under different titles, bundle configurations and regional model suffixes, and a wrong match produces a false price signal. For that reason, any price monitoring software is only as reliable as the matching beneath it. Retail price intelligence starts once clean monitoring data is combined with context: price history, assortment overlap and promotional calendars.
The need for this infrastructure has grown with online competition. Research by economist Alberto Cavallo found that the frequency of price changes at large multi-channel retailers doubled, from 15% per month in 2008–2010 to nearly 30% per month by 2014–2017. His work also points to the main driver: the categories most easily compared online, such as electronics and computers, saw the sharpest acceleration, while less searched categories kept far more stable prices.
How Often Do Competitor Prices Really Change?
There is no single answer, and averages hide most of what matters. At one end, Cavallo reported grocery prices remaining unchanged for about six months. At the other end, consumer electronics sold through marketplaces can reprice several times in a single day.
Volatility also varies inside a category, depending on who is selling. A Northeastern University study of Amazon Marketplace analyzed the strategies of more than 500 third-party sellers offering any of 1,640 best-selling products over four months, and found that algorithmic sellers were few, between 2% and 10%, yet covered almost a third of the best-selling products. Products offered by these sellers were close to ten times more volatile than products without them. Two similar SKUs in the same category can behave very differently.
The Price Volatility Index (PVI)
To make this measurable, Scraping Pros uses the Price Volatility Index (PVI). The PVI is the median number of hours between observed price changes per SKU, aggregated by category and compared across two windows: a baseline period and peak-season weeks such as Black Friday. Categories fall into three bands:
- Band A: repricing in less than 24 hours.
- Band B: repricing every one to seven days.
- Band C: repricing less often than once a week.
Categories move between bands. A product line that sits in Band B for most of the year can behave like Band A during Black Friday week.
The resolution problem
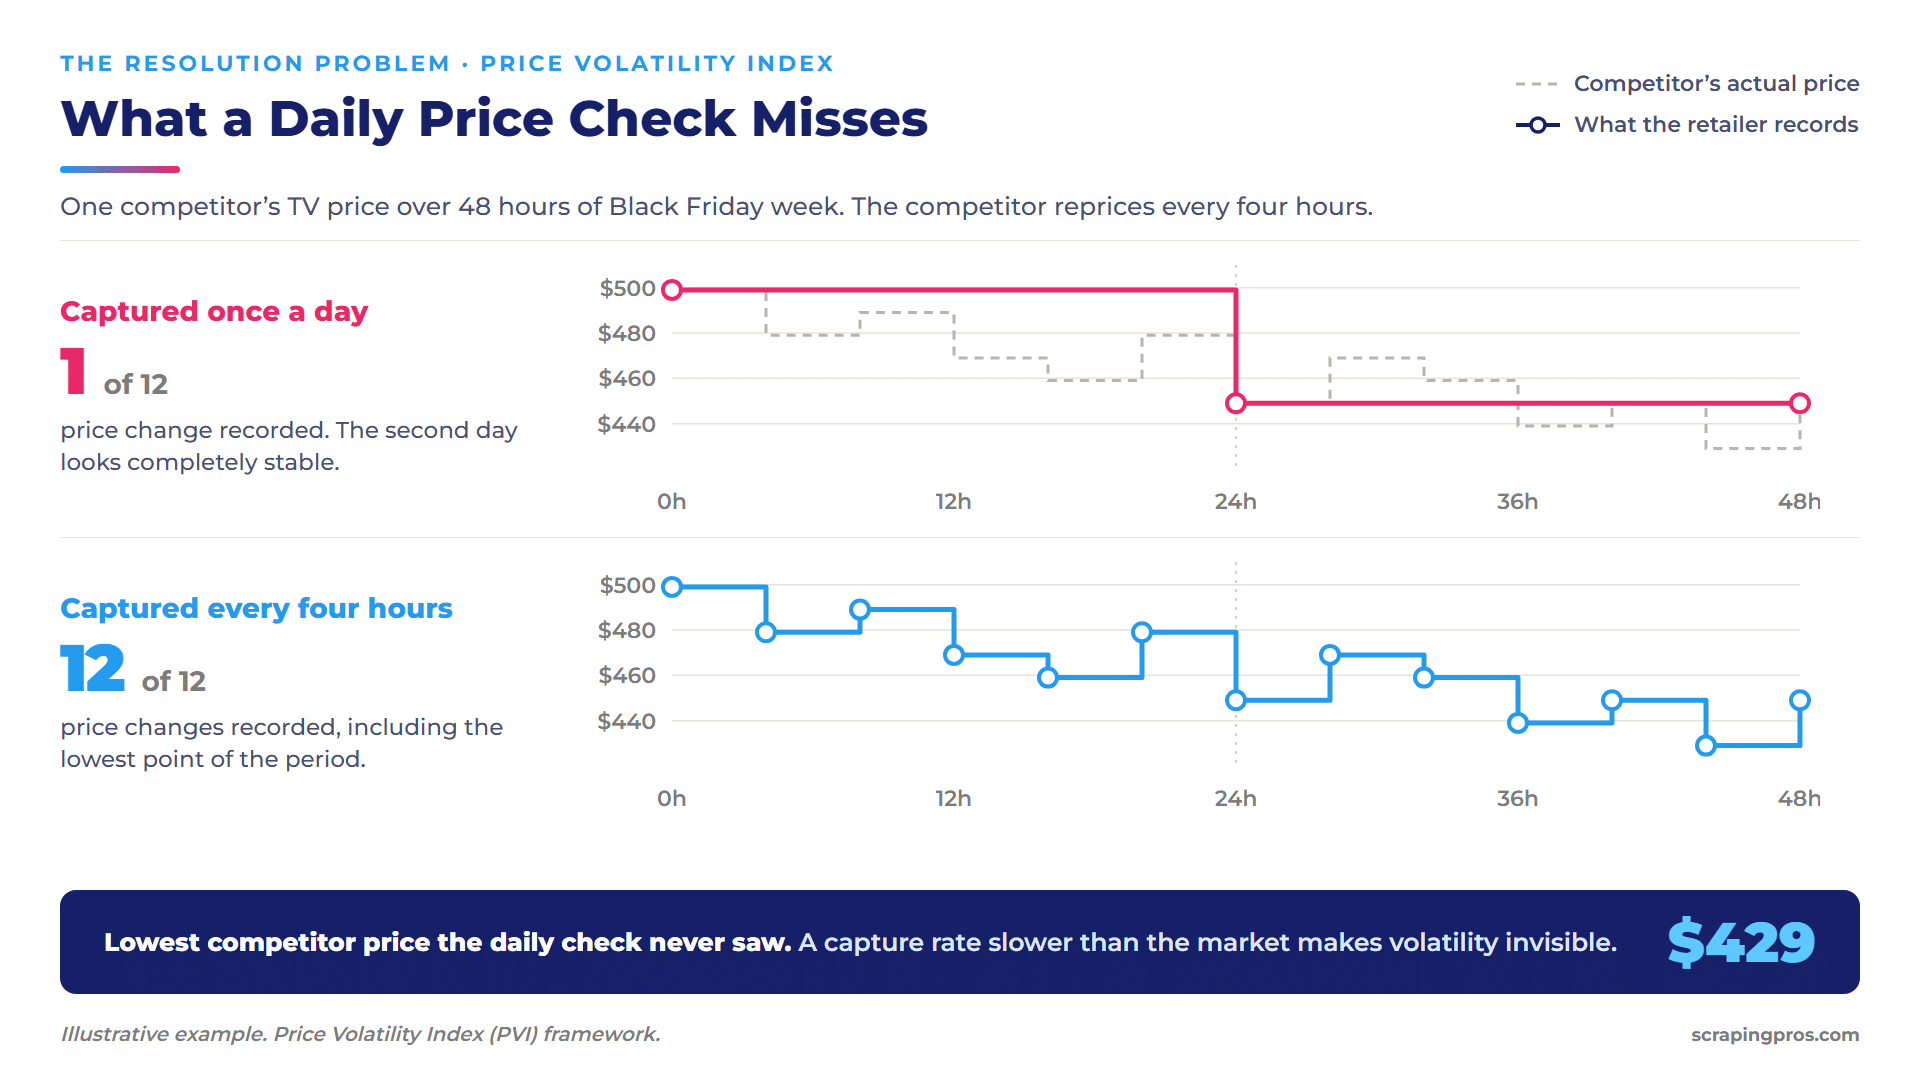
Measuring the PVI has a built-in trap: the capture frequency limits what can be seen. Consider a mid-sized electronics retailer whose price monitoring software checks competitor prices once a day. If a rival marketplace seller reprices a television every four hours during Black Friday week, the daily snapshot will record at most one change. The market will look calm while the retailer is undercut several times a day. Any honest PVI measurement therefore starts with a high-frequency capture period, and the operating cadence is set only after the real interval is known.
For Black Friday price monitoring, the window is also moving earlier. 2025 was the second holiday season in a row in which Black Friday growth outpaced Cyber Monday, as shoppers moved toward early, competitive deals. Price history matters as much as live prices: consumer group Which? tracked prices for a full year around Black Friday 2024 and found that 83% of products were cheaper or equal in price at least once outside the four-week sales period.
Monitoring vs. Dynamic Pricing: Not the Same Thing
The two terms are often used interchangeably, but they describe different layers of the same chain. Price monitoring software observes the market and delivers data. Dynamic pricing software takes that data, applies rules or algorithms, and changes the seller’s own price. The full sequence runs from capture and matching, through change detection and analysis, to decision and execution. Monitoring ends where the decision begins.
Separating the layers clarifies two common situations.
Monitoring without repricing. Many organizations monitor constantly and never reprice automatically. Manufacturers enforcing minimum advertised price (MAP) policies, distributors and category managers fall into this group. For them, monitoring is an end in itself.
Repricing on unreliable data. A dynamic pricing engine fed with poor data scales the error. The best-known case dates from April 2011, when biologist Michael Eisen found a developmental biology textbook, The Making of a Fly, listed on Amazon for more than $23 million. Two sellers’ algorithms were pricing against each other in a loop, and neither checked the result against any real market reference. Automated pricing also does not automatically mean the lowest price: the Northeastern researchers found that 60% of sellers using algorithmic pricing had prices above the lowest available price for the same product.
The same price monitoring software also supports brand protection. MAP monitoring detects advertised prices that fall below agreed thresholds. Unauthorized reseller monitoring identifies sellers outside the approved distribution network, often the first sign of gray-market stock. Listing checks catch altered titles, images or descriptions at the moment of highest traffic. In regulated markets the data has a compliance role as well: in the European Union, Directive 2019/2161 requires announced price reductions to reference the lowest price applied during at least the previous 30 days, which presupposes a reliable price history.
Choosing the Right Monitoring Frequency
Configuring price monitoring software with a single rule for every category either wastes capture capacity or misses the moves that matter. Frequency should follow five variables:
- Category volatility, measured by the PVI band.
- Revenue weight of the SKU. The products that concentrate most of the revenue deserve the highest cadence.
- Seasonal window. Frequency rises in the weeks around peak events and returns to baseline afterwards.
- Number of channels and sellers. More sellers increase the chance of algorithmic repricing.
- Action latency. If a team can respond only once a day, hourly captures add cost without changing decisions, except for MAP and listing alerts that require immediate escalation.
The practical rule is to capture at least two or three times within the shortest repricing interval observed in the band during that window.
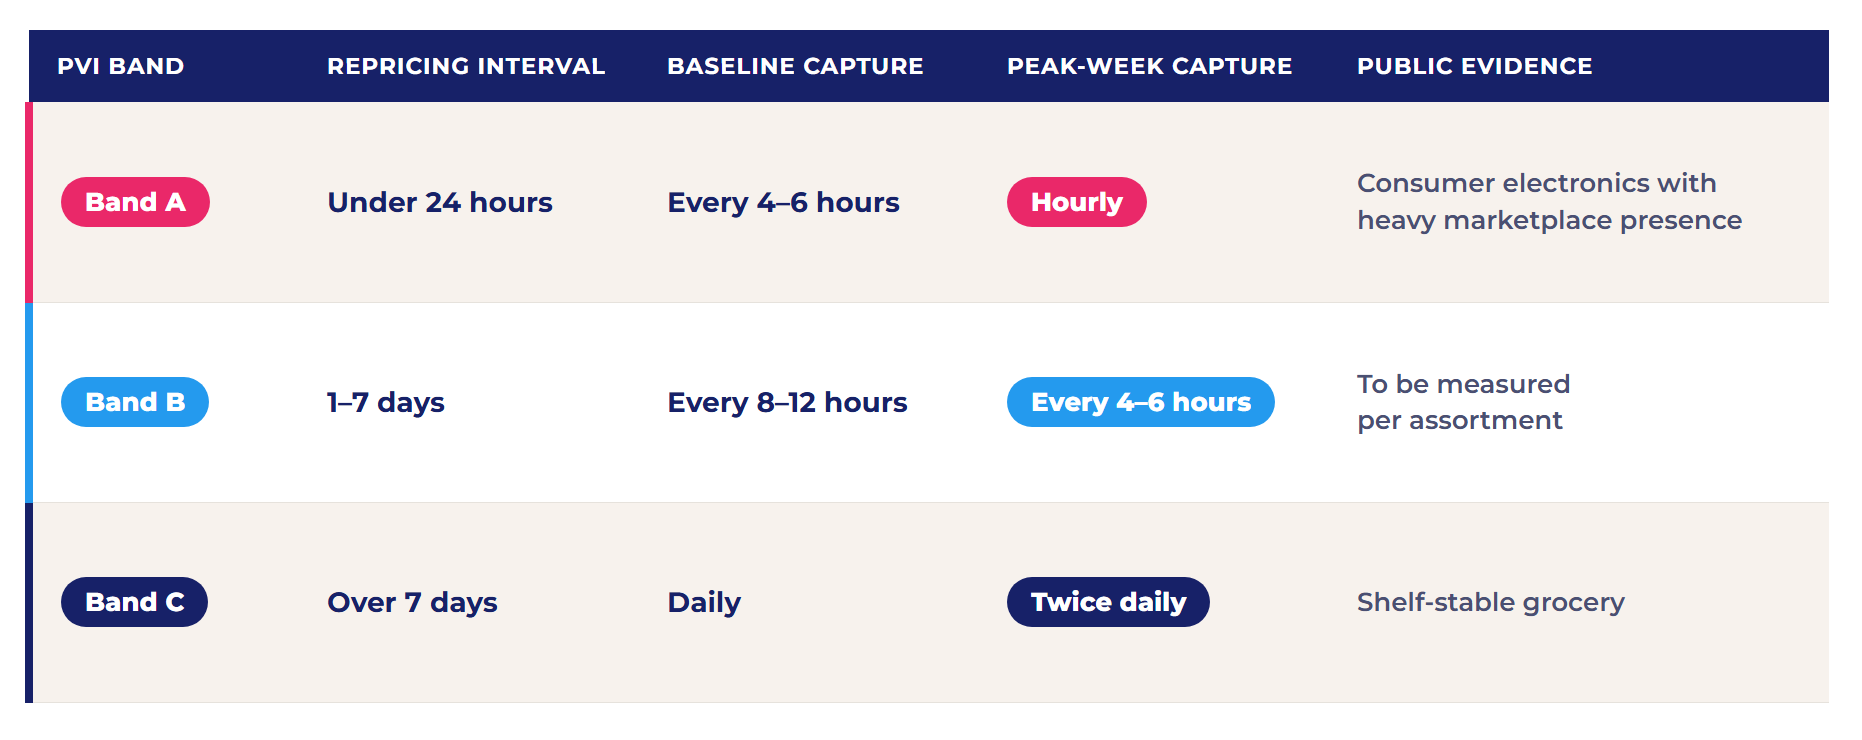
A realistic scenario: a home appliance brand sells through three national retailers and around forty marketplace sellers. Its flagship models sit in Band B for most of the year but move into Band A in November, driven by marketplace sellers. The brand runs high-frequency capture from early November, keeps hourly MAP alerts on the flagship models through Cyber Monday, and returns to twice-daily capture in December. Retailers can also commit publicly to price standards: in 2024, UK retailer Currys promised that none of its Black Friday deals would have been cheaper in the previous six months, and Which? confirmed it kept that promise. Commitments of that kind can only be verified with a continuous price record.
Action Items
- Measure the PVI per category with a high-frequency capture period before fixing a cadence.
- Rank SKUs by revenue weight and assign frequencies by tier.
- Raise capture frequency at least two weeks before Black Friday.
- Audit product matching quality before feeding any pricing engine.
- Set MAP and unauthorized reseller alerts across every channel.
- Keep a complete price history to validate discounts and meet regulatory requirements.
FAQ
What Is Price Monitoring Software, Exactly?
Price monitoring software continuously captures competitor prices, promotions, stock and listings across channels, normalized for comparison over time.
How Often Do Competitor Prices Actually Change?
It depends on the category and the sellers involved. It ranges from several times a day in marketplace electronics to months in shelf-stable grocery.
What’s the Difference Between Monitoring and Dynamic Pricing?
Monitoring collects and validates market data. Dynamic pricing software uses that data to change prices automatically.
How Do You Choose a Monitoring Frequency by Category?
By measuring the real repricing interval first, then capturing two or three times within the shortest interval observed.
What Is MAP Monitoring?
The tracking of advertised prices across channels to detect listings below a manufacturer’s minimum advertised price.
