Measuring alternative data ROI after deploying a signal is measuring the return on a decision already made. The framework below is designed to quantify the edge before budget is committed: a three-stage evaluation process, signal-category benchmarks, and a business case checklist that holds up in front of an investment committee.
This is the third post in Scraping Pros’ finance series. The first, What Is Financial Data Scraping?, covered the four public signal types and the Signal Latency Score. The second, Real-Time Data Pipeline: Proven 4-Stage Architecture, documented pipeline architecture and the freshness decay curve. This post connects both to the investment decision itself — and to how alternative data ROI is defended in front of a committee.
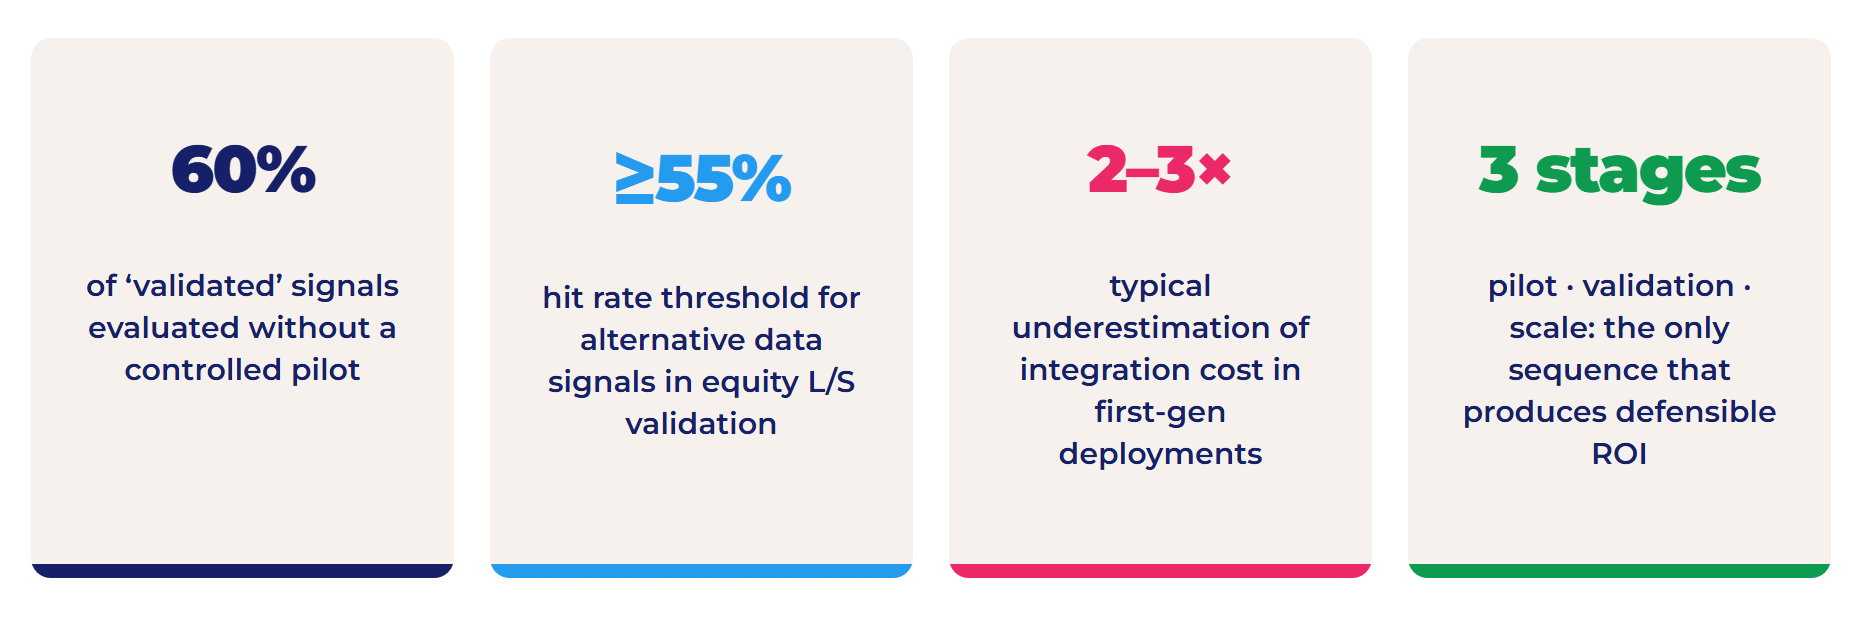
- 60% of ‘validated’ signals evaluated without a controlled pilot — Scraping Pros, 2024–2026
- ≥55% hit rate threshold for alternative data signals in equity L/S validation
- 2–3× typical underestimation of integration cost in first-gen deployments
- 3 stages — pilot · validation · scale — the only sequence that produces defensible ROI
1. How to Actually Measure Alternative Data ROI
Alternative data ROI has three distinct measurement layers. Collapsing them into a single metric — cost of signal versus alpha generated — produces a number that is easy to calculate and meaningless to act on.
Each layer answers a different question, requires a different methodology, and informs a different decision.
Layer 1 — Signal value: does this signal contain genuine informational content?
Two tests, run before any infrastructure investment.
Test 1: correlation with the target event. Does the signal move before the financial event it claims to predict — earnings revision, guidance change, restructuring — and with enough lead time to be actionable?
The Signal Latency Score benchmarks from the first post in this series provide the reference: hiring signals average 45–90 days of anticipation, web traffic 21–45 days, sentiment 14–30 days, pricing 7–21 days. A signal that shows no statistically meaningful correlation within those windows has no signal value.
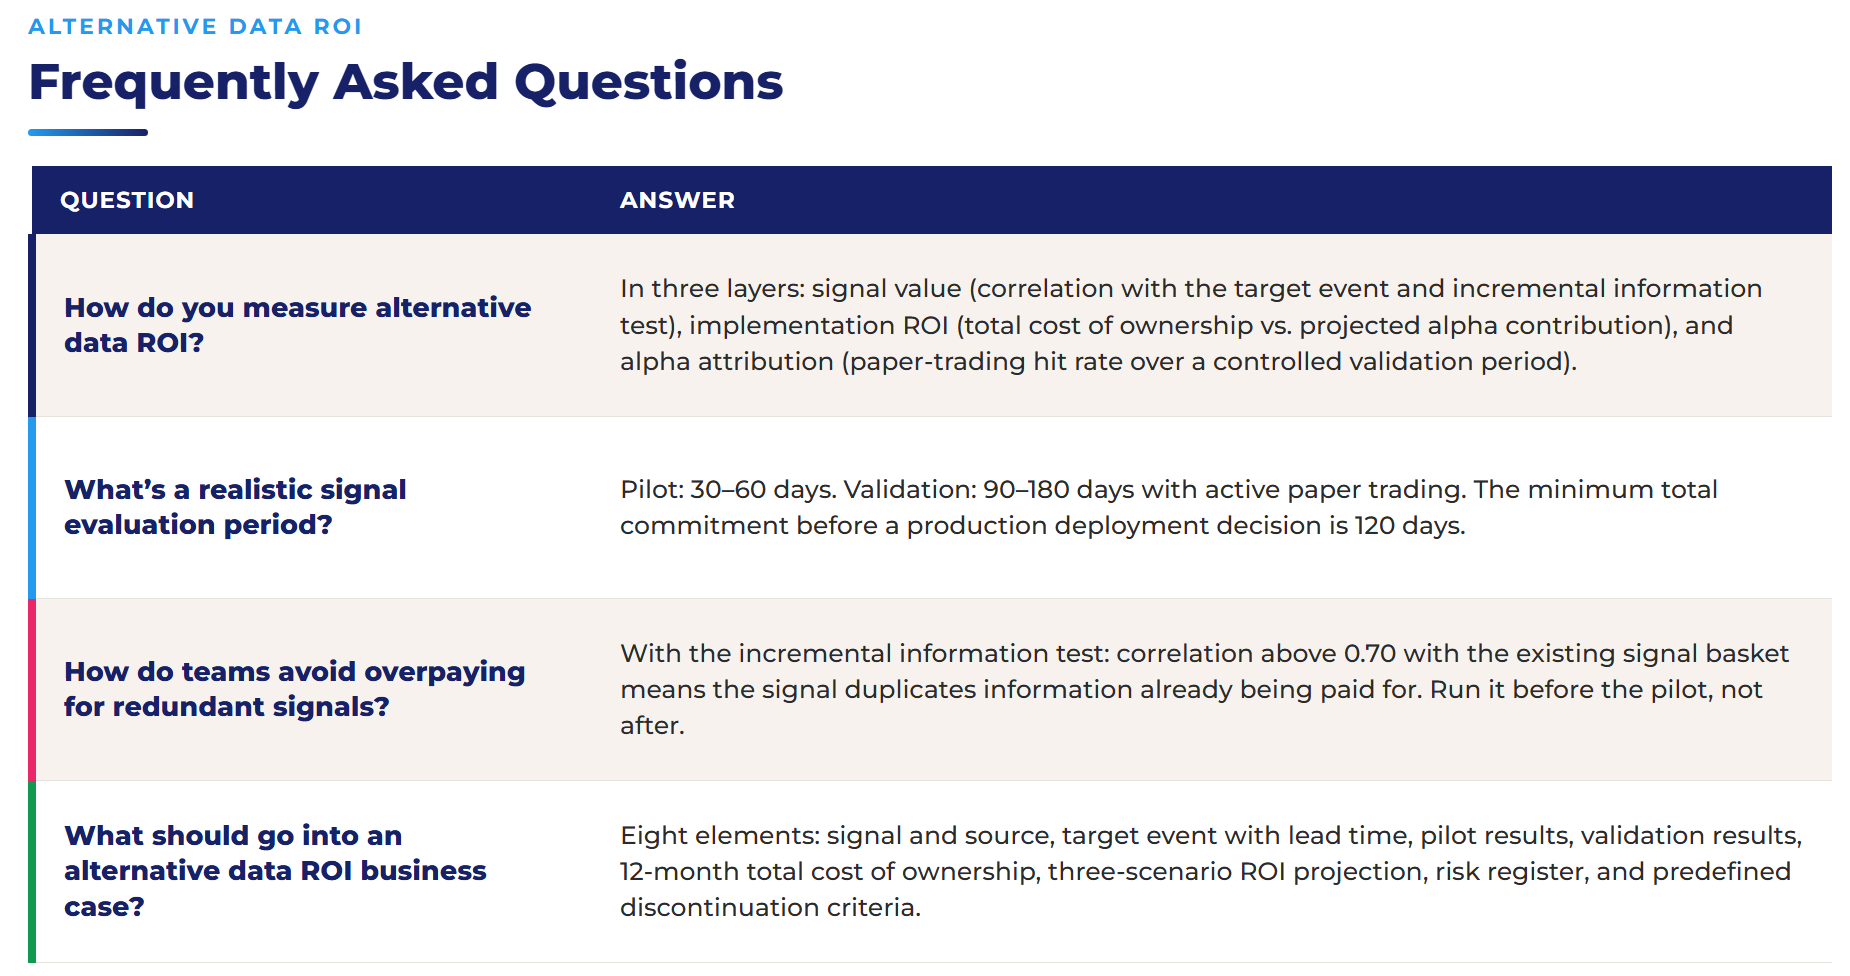
Test 2: incremental information. Does the signal add marginal information when combined with signals the team already uses? Correlation above 0.70 with an existing signal basket means the team is buying redundancy.
The alternative data ROI of a redundant signal is negative by definition — it adds cost without adding decision-relevant content.
Layer 2 — Implementation ROI: is the production cost proportional to value?
The total cost of ownership for an alternative data signal has three components that are rarely summed together in an evaluation:
- Acquisition cost (vendor subscription or scraping infrastructure): the one teams estimate.
- Integration cost: engineering time to normalize entities, validate data quality, build the historical baseline, and connect the signal to the decision system. In Scraping Pros’ experience with first-generation deployments, it is consistently underestimated by 2–3×.
- Maintenance cost: 30–45% of integration cost annually. It is almost never included in the initial business case, even though it is permanent as long as the signal is in production.
Leaving maintenance out of the model overstates alternative data ROI for every year the signal stays in production.
Layer 3 — Alpha attribution: what fraction of return can be traced to this signal?
This is the layer where alternative data ROI becomes an attributable number. Two methodologies, each with documented limitations:
- Backtesting with signal on/off: compares two hypothetical portfolios identical in every dimension except whether they use the signal. The limitation: contamination risk if the signal calibration period overlaps with the evaluation period.
- Paper trading with an isolated signal book: runs a paper portfolio based exclusively on the new signal during the pilot period. It is prospective and free of look-ahead bias, but requires a minimum of 60–90 days to produce statistically significant results.
Both methodologies should be run in parallel and their results compared. Significant divergence between backtest and paper trading results is itself a diagnostic signal that the backtest methodology has a flaw.
2. A Three-Stage Framework to Validate Alternative Data ROI
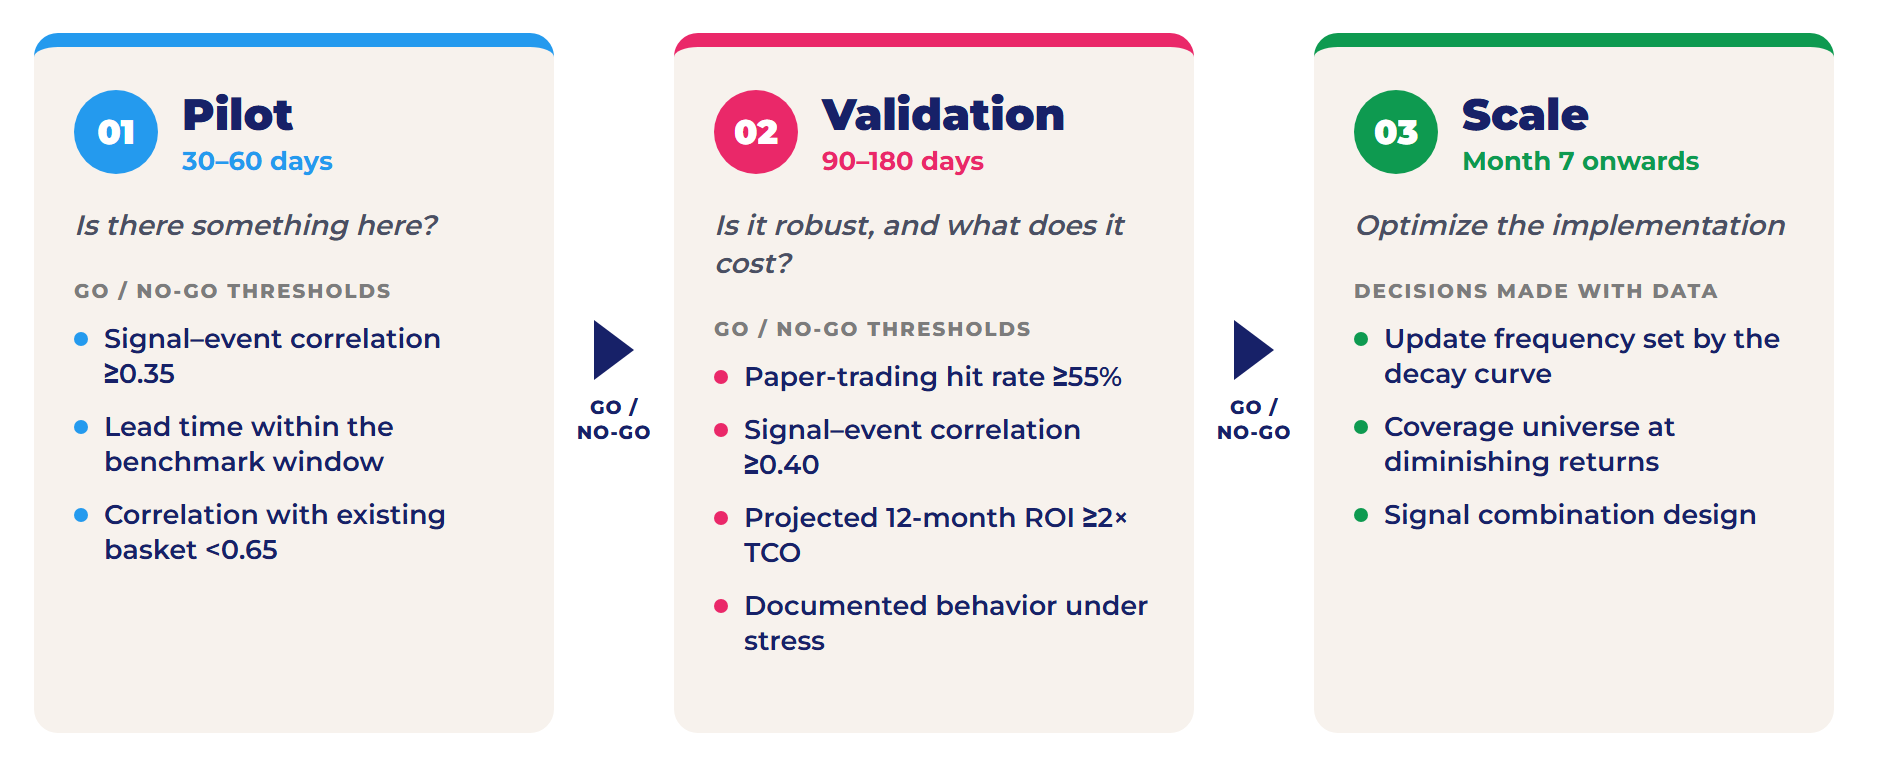
Stage 1 — Pilot (30–60 days)
One objective: determine whether the signal contains genuine informational content under current market conditions.
The pilot does not measure alternative data ROI. It does not build the business case. It answers one question: is there something here?
Entry criteria:
- Access to the signal with at least 12 months of historical data.
- A defined target event.
- A documented baseline of existing signals for incremental value comparison.
- A fixed evaluation period that is not extendable if results are ambiguous.
Go/no-go thresholds:
- Signal-event correlation ≥0.35 (a low threshold because the period is short, but the direction must be clear).
- Signal lead time within the benchmark window for that signal type.
- Correlation with the existing signal basket below 0.65.
Stage 2 — Validation (90–180 days)
Two objectives: confirm that the pilot’s informational content is robust rather than statistical noise, and quantify the total cost of ownership for the business case.
Active paper trading runs throughout the entire validation period — the performance of that book is the primary input to the investment committee presentation. The hit rate benchmark for alternative data signals in equity long-short strategies is 55% or above over the full validation period, based on Scraping Pros deployment data across investment teams in North America and Europe.
Stress testing is mandatory. The validation must cover at least one episode of elevated market volatility or sector-specific stress, because alternative data signals consistently underperform during broad risk-off regimes, when macro factors dominate idiosyncratic signals. A signal validated only in calm market conditions is a signal not validated.
Go/no-go thresholds:
- Hit rate ≥55% in paper trading over the full period.
- Signal-event correlation ≥0.40 in the validation data.
- Projected 12-month alternative data ROI ≥2× total cost of ownership.
- Documented hit-rate behavior during stress periods.
Stage 3 — Scale (month 7 onwards)
Scale is not when the signal gets validated — it is when its implementation gets optimized. Three decisions must be made with data, not by default:
- Optimal update frequency: calibrated to the freshness decay curve of the signal type — not set to the maximum technically achievable.
- Optimal coverage universe: the point of diminishing returns, where additional entities in the monitored set add less marginal signal value than they add infrastructure cost.
- Signal combination design: two signals with independent hit rates of 58% can produce a combined hit rate of 71% when they converge — or cancel out when positively correlated.
Combination design is Stage 3’s highest-leverage work.
Case study: hiring intelligence for a consumer equity fund
United States / Canada · Equity long-short fund — consumer sector
The challenge. A North American equity fund approached Scraping Pros to evaluate a hiring intelligence signal for the consumer retail sector. The team was monitoring a universe of listed companies using quarterly headcount data from earnings calls — a lag of up to 90 days on any meaningful workforce signal. The question: could systematic job posting extraction at role level generate actionable lead time before earnings revisions?
The pilot (45 days). Scraping Pros segmented daily posting data by function — merchandising, supply chain, store operations, corporate — across the fund’s monitored universe. The pilot produced a statistically significant correlation between supply chain role contractions and gross margin guidance revisions in the subsequent quarter. The average lead time sat comfortably within the 45–90 day hiring signal benchmark.
Validation (120 days). An active paper trading book ran exclusively on the signal. It closed the validation period above the 55% hit rate threshold set as the go/no-go criterion.
The outcome. Total cost of ownership for the first 12 months of production — infrastructure, integration, and maintenance — came in within the typical range for hiring intelligence deployments at this coverage level. In the base case scenario, the projected alternative data ROI was above 3× total cost of ownership.
The investment committee approved deployment with predefined discontinuation criteria: if the rolling hit rate fell below a pre-agreed floor in any 60-day window, the signal would be reviewed for suspension.
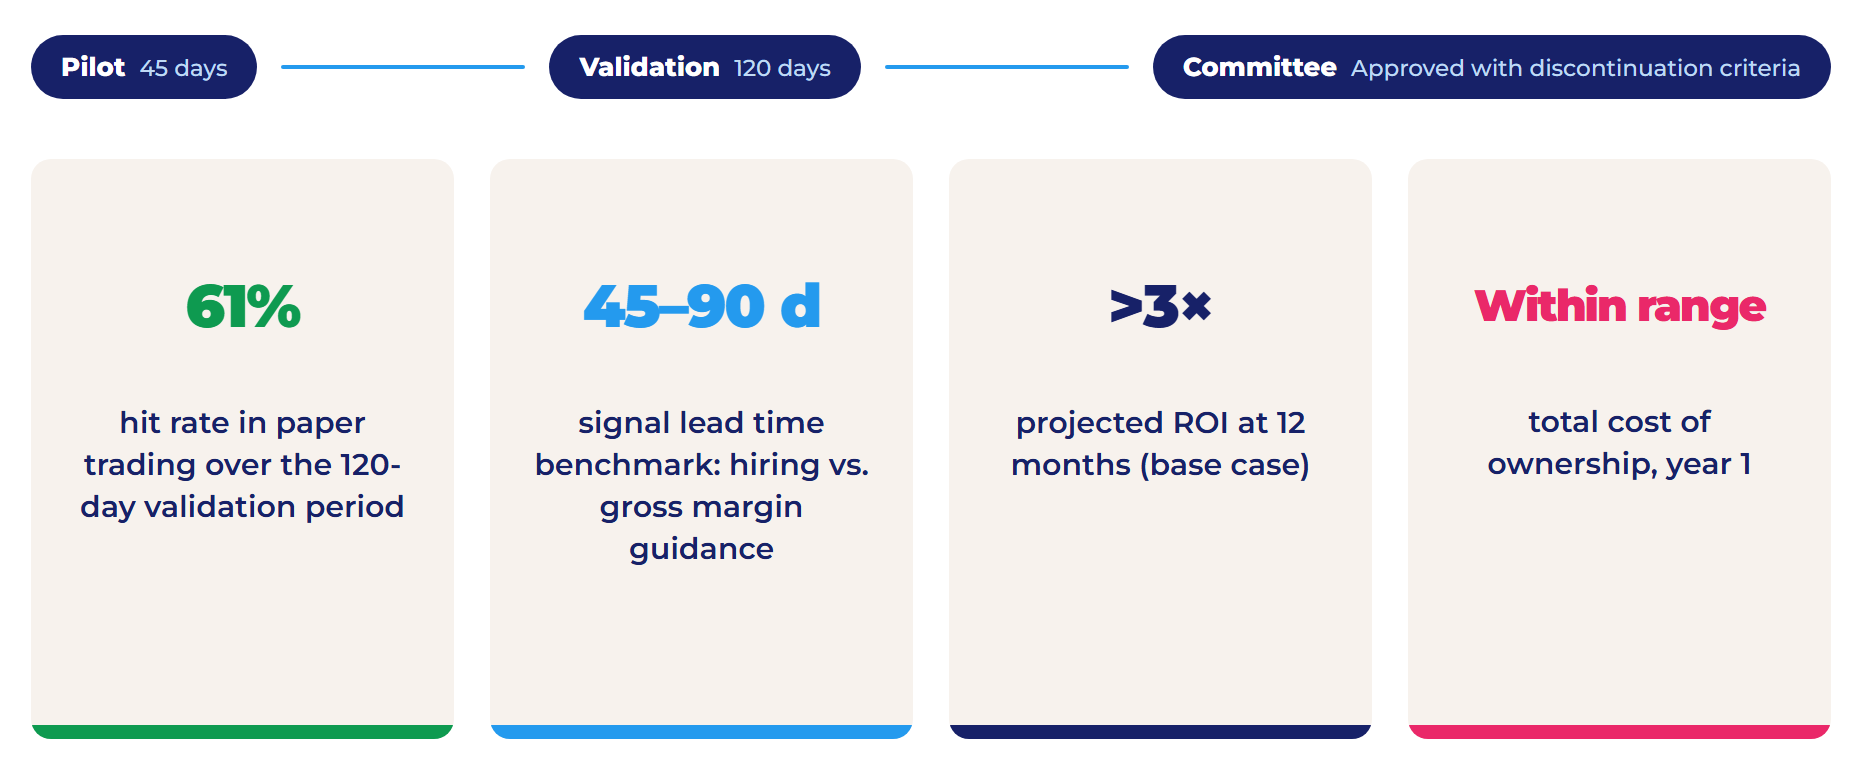
- 61% hit rate in paper trading — 120-day validation period
- 45–90 d signal lead time benchmark — hiring vs. gross margin guidance
- >3× projected ROI at 12 months (base case)
- Within range total cost of ownership — year 1
3. Comparing Signal Categories by Relative Value
Signal value is not a property of the signal type in isolation — it is a function of the strategy.
The table below maps the four signal categories from the Signal Latency Score against the investment strategies where each produces the highest relative alternative data ROI. It also shows the infrastructure cost index and market saturation — the two factors that erode ROI over time.
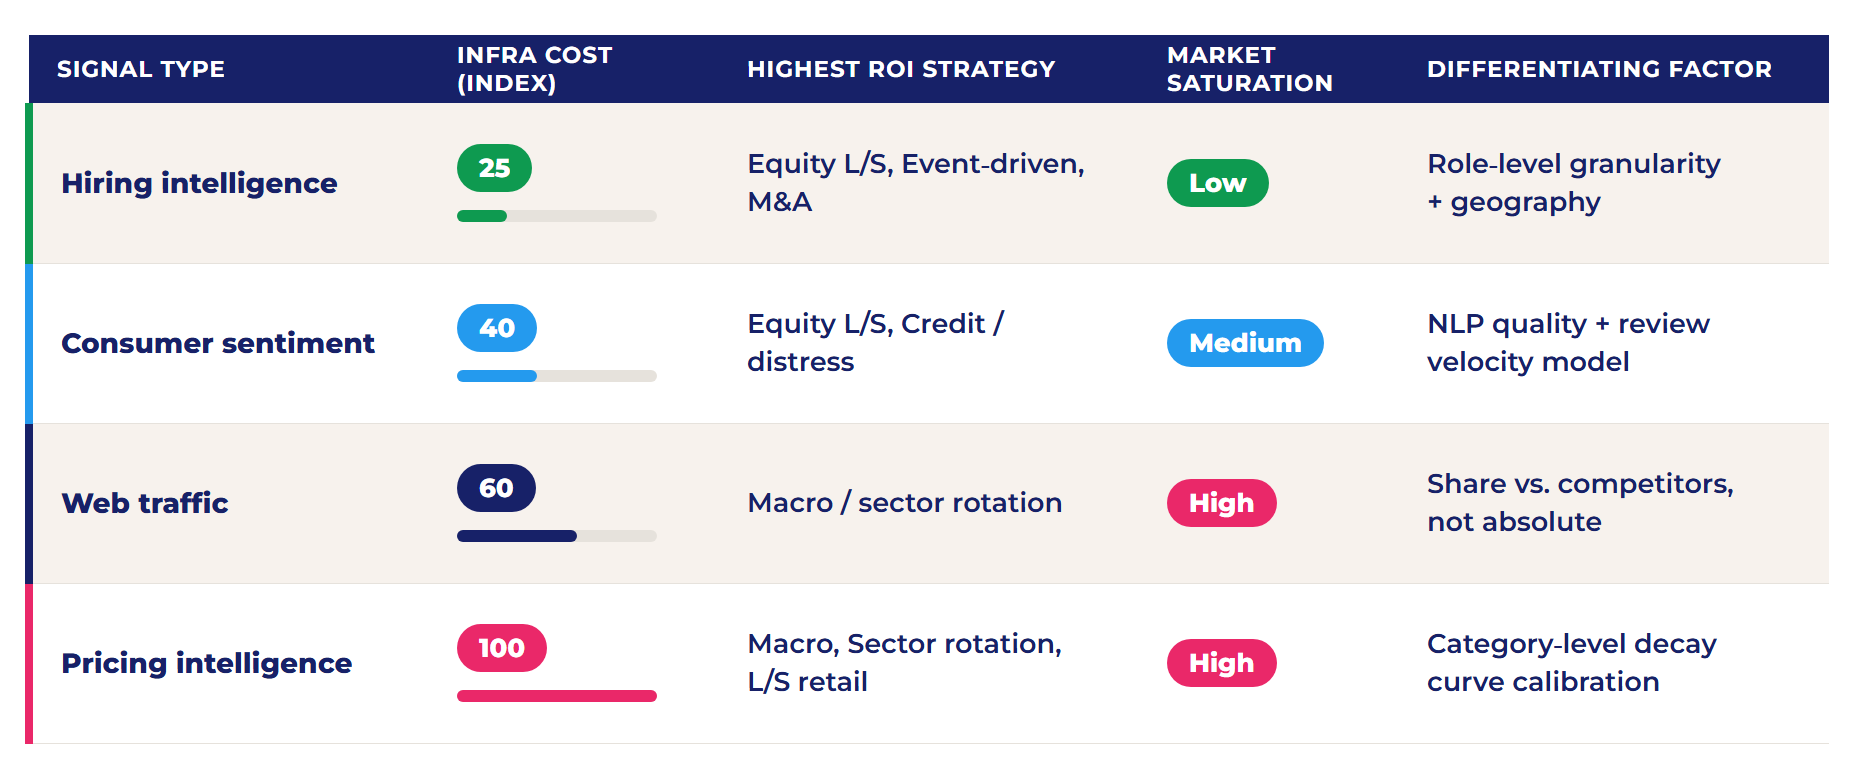
Infrastructure cost index: 100 = highest cost category. Scraping Pros deployment benchmarks, 2024–2026.
The saturation column is the one most frequently ignored in alternative data ROI calculations. A signal that 40% of participants in a given market already use has a materially lower alpha contribution than the same signal three years earlier.
Pricing and web traffic signals in US equities are in this position. Hiring signals with role-level granularity and sentiment signals with production-quality NLP are not: most implementations in these categories use coarser versions of the signal, which leave significant informational content on the table.
4. Building the Alternative Data ROI Business Case for the Investment Committee
An alternative data business case fails an investment committee for one of two reasons:
- Too technical: the committee cannot evaluate whether a 57% hit rate is good or bad without context.
- Too vague: no cost breakdown, no methodology, no discontinuation criteria.
The checklist below is structured to avoid both failures.
- The signal and its source: what data is extracted, from which public sources, at what frequency, under what compliance framework. Includes the Signal Latency Score benchmark for the signal type.
- The target event: the specific financial event the signal predicts, with the expected lead time. ‘Predicts stock performance’ is too vague for committee evaluation. ‘Predicts gross margin guidance revisions in consumer retail with 45–60 days of anticipation’ is evaluable.
- Pilot results: observed signal-event correlation, empirical lead time, incremental value versus the existing signal basket, and market conditions during the pilot period.
- Validation results: paper trading hit rate, Sharpe ratio of the signal book, maximum drawdown, and documented behavior during the stress period included in the validation window.
- Total cost of ownership — 12 months: acquisition or infrastructure cost, integration (engineering time at fully loaded cost), and projected annual maintenance, with a source for each estimate.
- Projected alternative data ROI — three scenarios: base case (hit rate equal to validation), conservative (hit rate 10% below validation), and stress (conditions equivalent to the worst period in validation). Applied to the relevant AUM of the strategy.
- Risk register: three risks apply to any alternative data signal — market saturation (alpha decays as adoption grows), source change (the platform modifies its structure and the signal becomes unextractable), and model drift (the relationship between signal and event shifts over time). Include a mitigation for each.
- Continuation and discontinuation criteria: the predefined thresholds the committee approves in advance. Without them, the decision to suspend a deteriorating signal is always deferred. With them, it is automatic.
The argument that moves investment committees: methodology is more valuable than pilot results.
A pilot that produces mediocre results with rigorous methodology — controlled period, documented baseline, predefined metrics — is more credible than a brilliant pilot without methodology. The first is reproducible. The second is anecdotal.
Action Items
- Run the incremental information test before the pilot: calculate the correlation between the candidate signal and the team’s existing signal basket. If it exceeds 0.70, redesign the signal before investing in infrastructure.
- Fix the pilot period before it starts: define the duration, the target event, the go/no-go thresholds, and the conditions under which the pilot will be extended (none) or repeated with a modified design. Ambiguous pilots produce ambiguous results.
- Include integration and maintenance in the cost model from day one: the business case must show total cost of ownership at 12 months, not acquisition cost alone. Acquisition-only models overstate alternative data ROI, because integration runs 2–3× the acquisition estimate in first-generation deployments.
- Run paper trading throughout the validation period, not just at the end: intra-period hit rate monitoring reveals whether the signal is stable, or whether the aggregate result is masking volatility that would be unacceptable in production.
- Define discontinuation criteria before the committee vote: the thresholds for suspension (rolling hit rate, signal-event correlation decay, freshness SLA breach rate) should be part of the deployment approval, not a separate future decision.