
Financial Data Intelligence 2026
The Alternative Data Playbook for Investment Teams
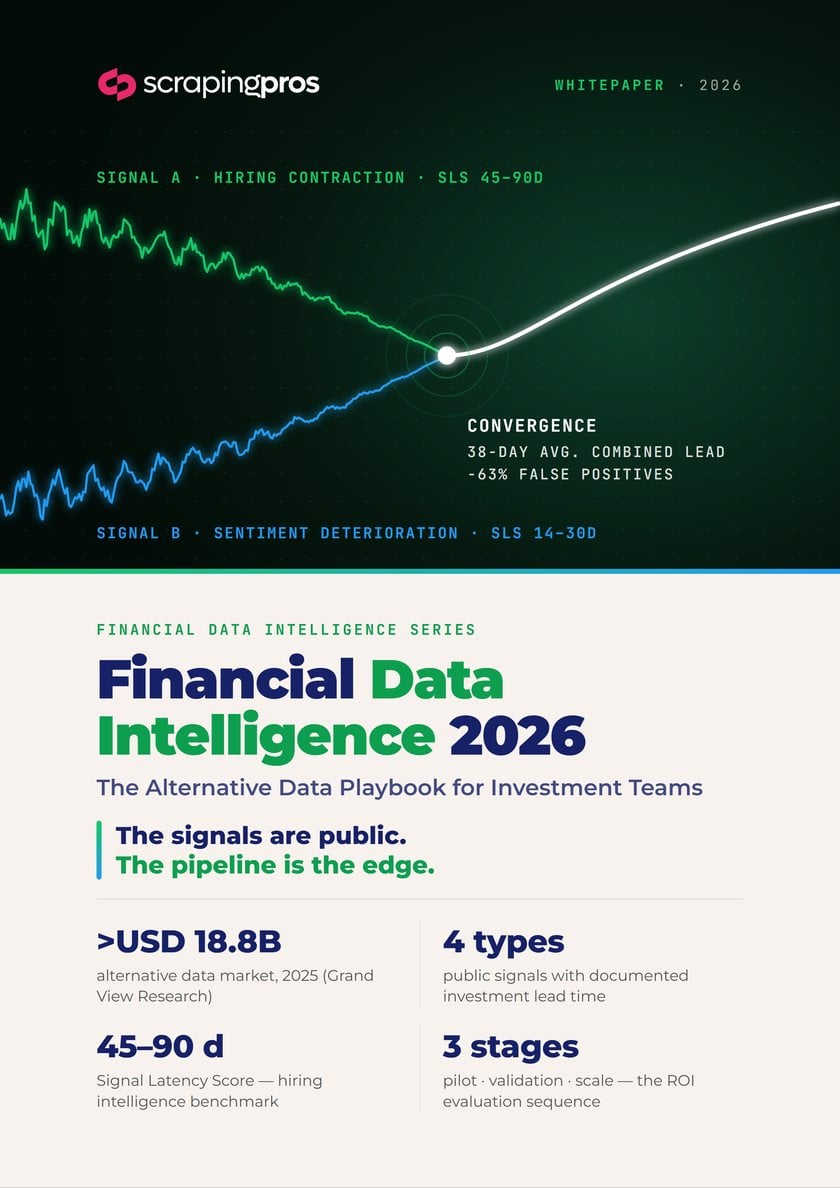
The signals are public. The pipeline is the edge. This playbook synthesizes Scraping Pros' Signal Latency Score framework, real-time pipeline architecture, and alternative data ROI methodology — with four signal case studies drawn from production deployments.
What You'll Learn
The complete Scraping Pros financial data intelligence framework, built on production deployments across 200+ enterprise clients, 2024–2026.
How early each public signal moves
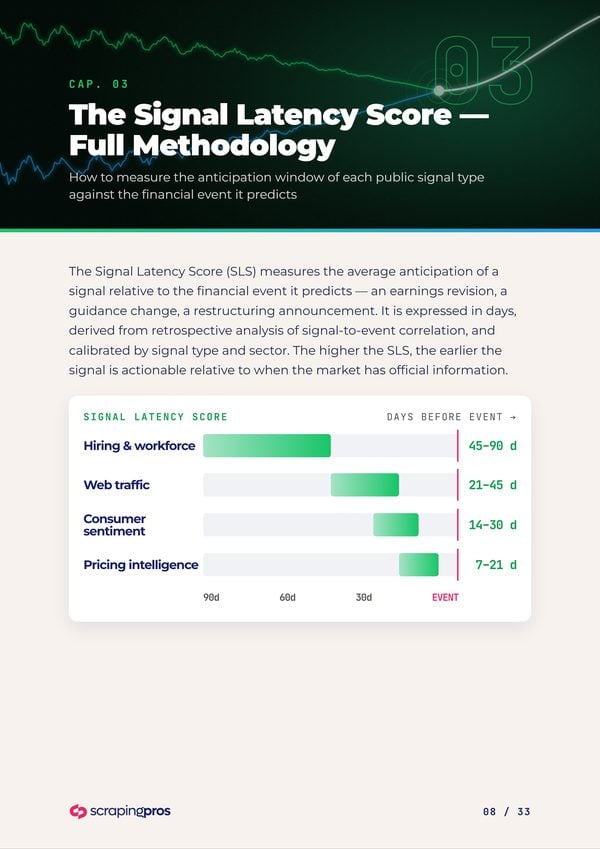
The full SLS methodology: hiring 45–90 days, web traffic 21–45, sentiment 14–30, pricing 7–21 — and how to calibrate it for your own sector.
Architecture for signals that expire
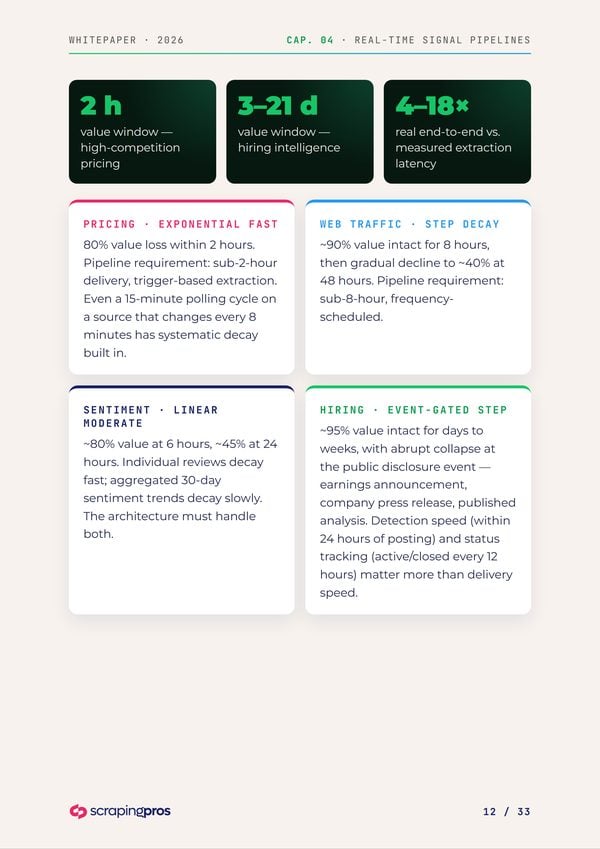
Freshness decay curves, the four-stage reference architecture, and why real end-to-end latency runs 4–18× higher than what teams measure.
Two signals beat one
How two-signal convergence cut false positives by 58–67% — and the hiring + sentiment combination that delivered a 38-day average lead.
Four production deployments
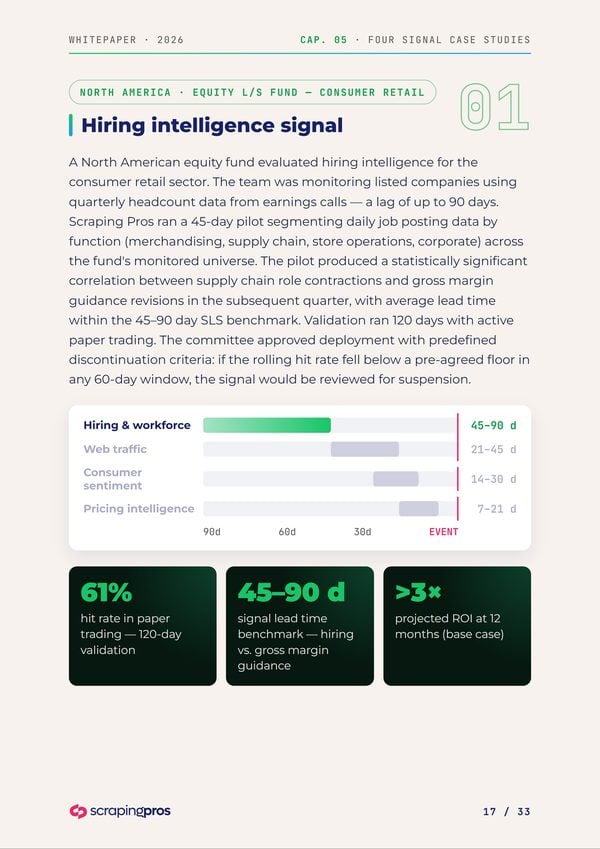
Hiring, pricing, sentiment and web footprint across North America, Europe and Latin America — including a 61% paper-trading hit rate and <90 min P95 latency.
Defensible in front of an auditor
The three-principle framework — public access only, ToS as operating guide, MNPI as an absolute line — plus a data governance checklist.
The honest decision framework
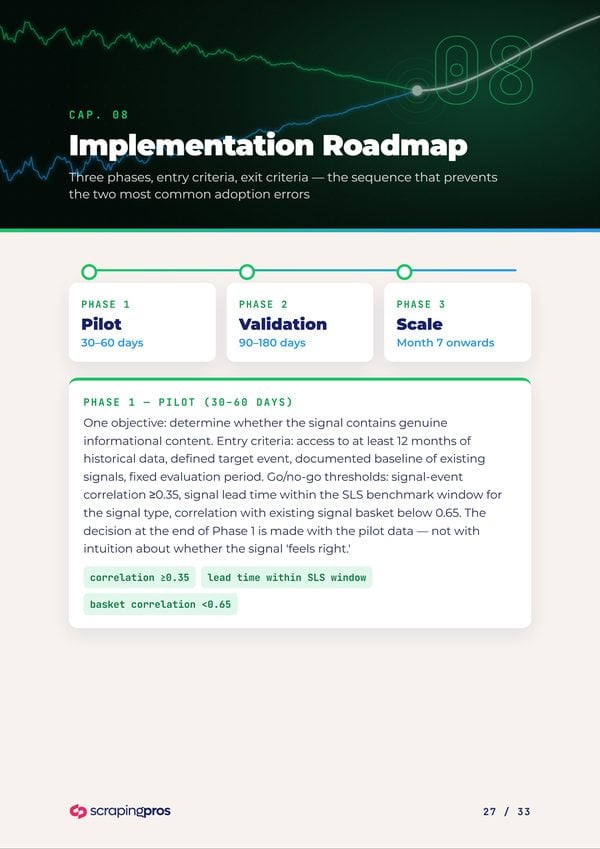
The true cost of building in-house ($140K–$420K initial build, 30–45% yearly maintenance), a decision matrix, and a 3-phase pilot · validation · scale roadmap.
Explore the Signal Latency Score
Pick a signal type to see how far ahead of the financial event it moves, how fast its value decays, and what the pipeline must deliver.
- PIPELINE REQUIREMENT
- Daily detection, 12h status refresh
- STRATEGY FIT
- Equity L/S, Event-driven, M&A
- RESIDUAL VALUE
- ~95% value intact for days to weeks, with abrupt collapse at the public disclosure event.
A Look Inside
Frameworks, benchmarks and production case studies — designed to be read, shared with your investment committee, and put to work.
Who Is This For?
Investment teams in equity, credit and macro strategies — and the data, engineering and compliance teams that support them.
The signals are public.
The pipeline is the edge.
Download the free playbook and turn public web signals into a measurable investment edge.
Download Free Whitepaper